About the Project
Personal Finance Tracker is a multi-page web app built with Python and Streamlit that helps you take real control of your finances. It tracks income and expenses, visualizes spending patterns through interactive Plotly charts, and lets you set and monitor monthly budgets per category.
The data pipeline uses Pandas for loading, cleaning, deduplication, and aggregation, all stored locally in CSV files so there's no database setup required. The app is split across four pages: an overview dashboard with KPI cards, a transaction manager, an interactive charts view, and a budget tracker with color-coded progress bars.
This came from a real need; I wanted to actually see where my money was going each month. Building it myself meant I could tailor every metric, category, and chart to what was actually useful, rather than working around a generic app's limitations.
Preview
Key Features
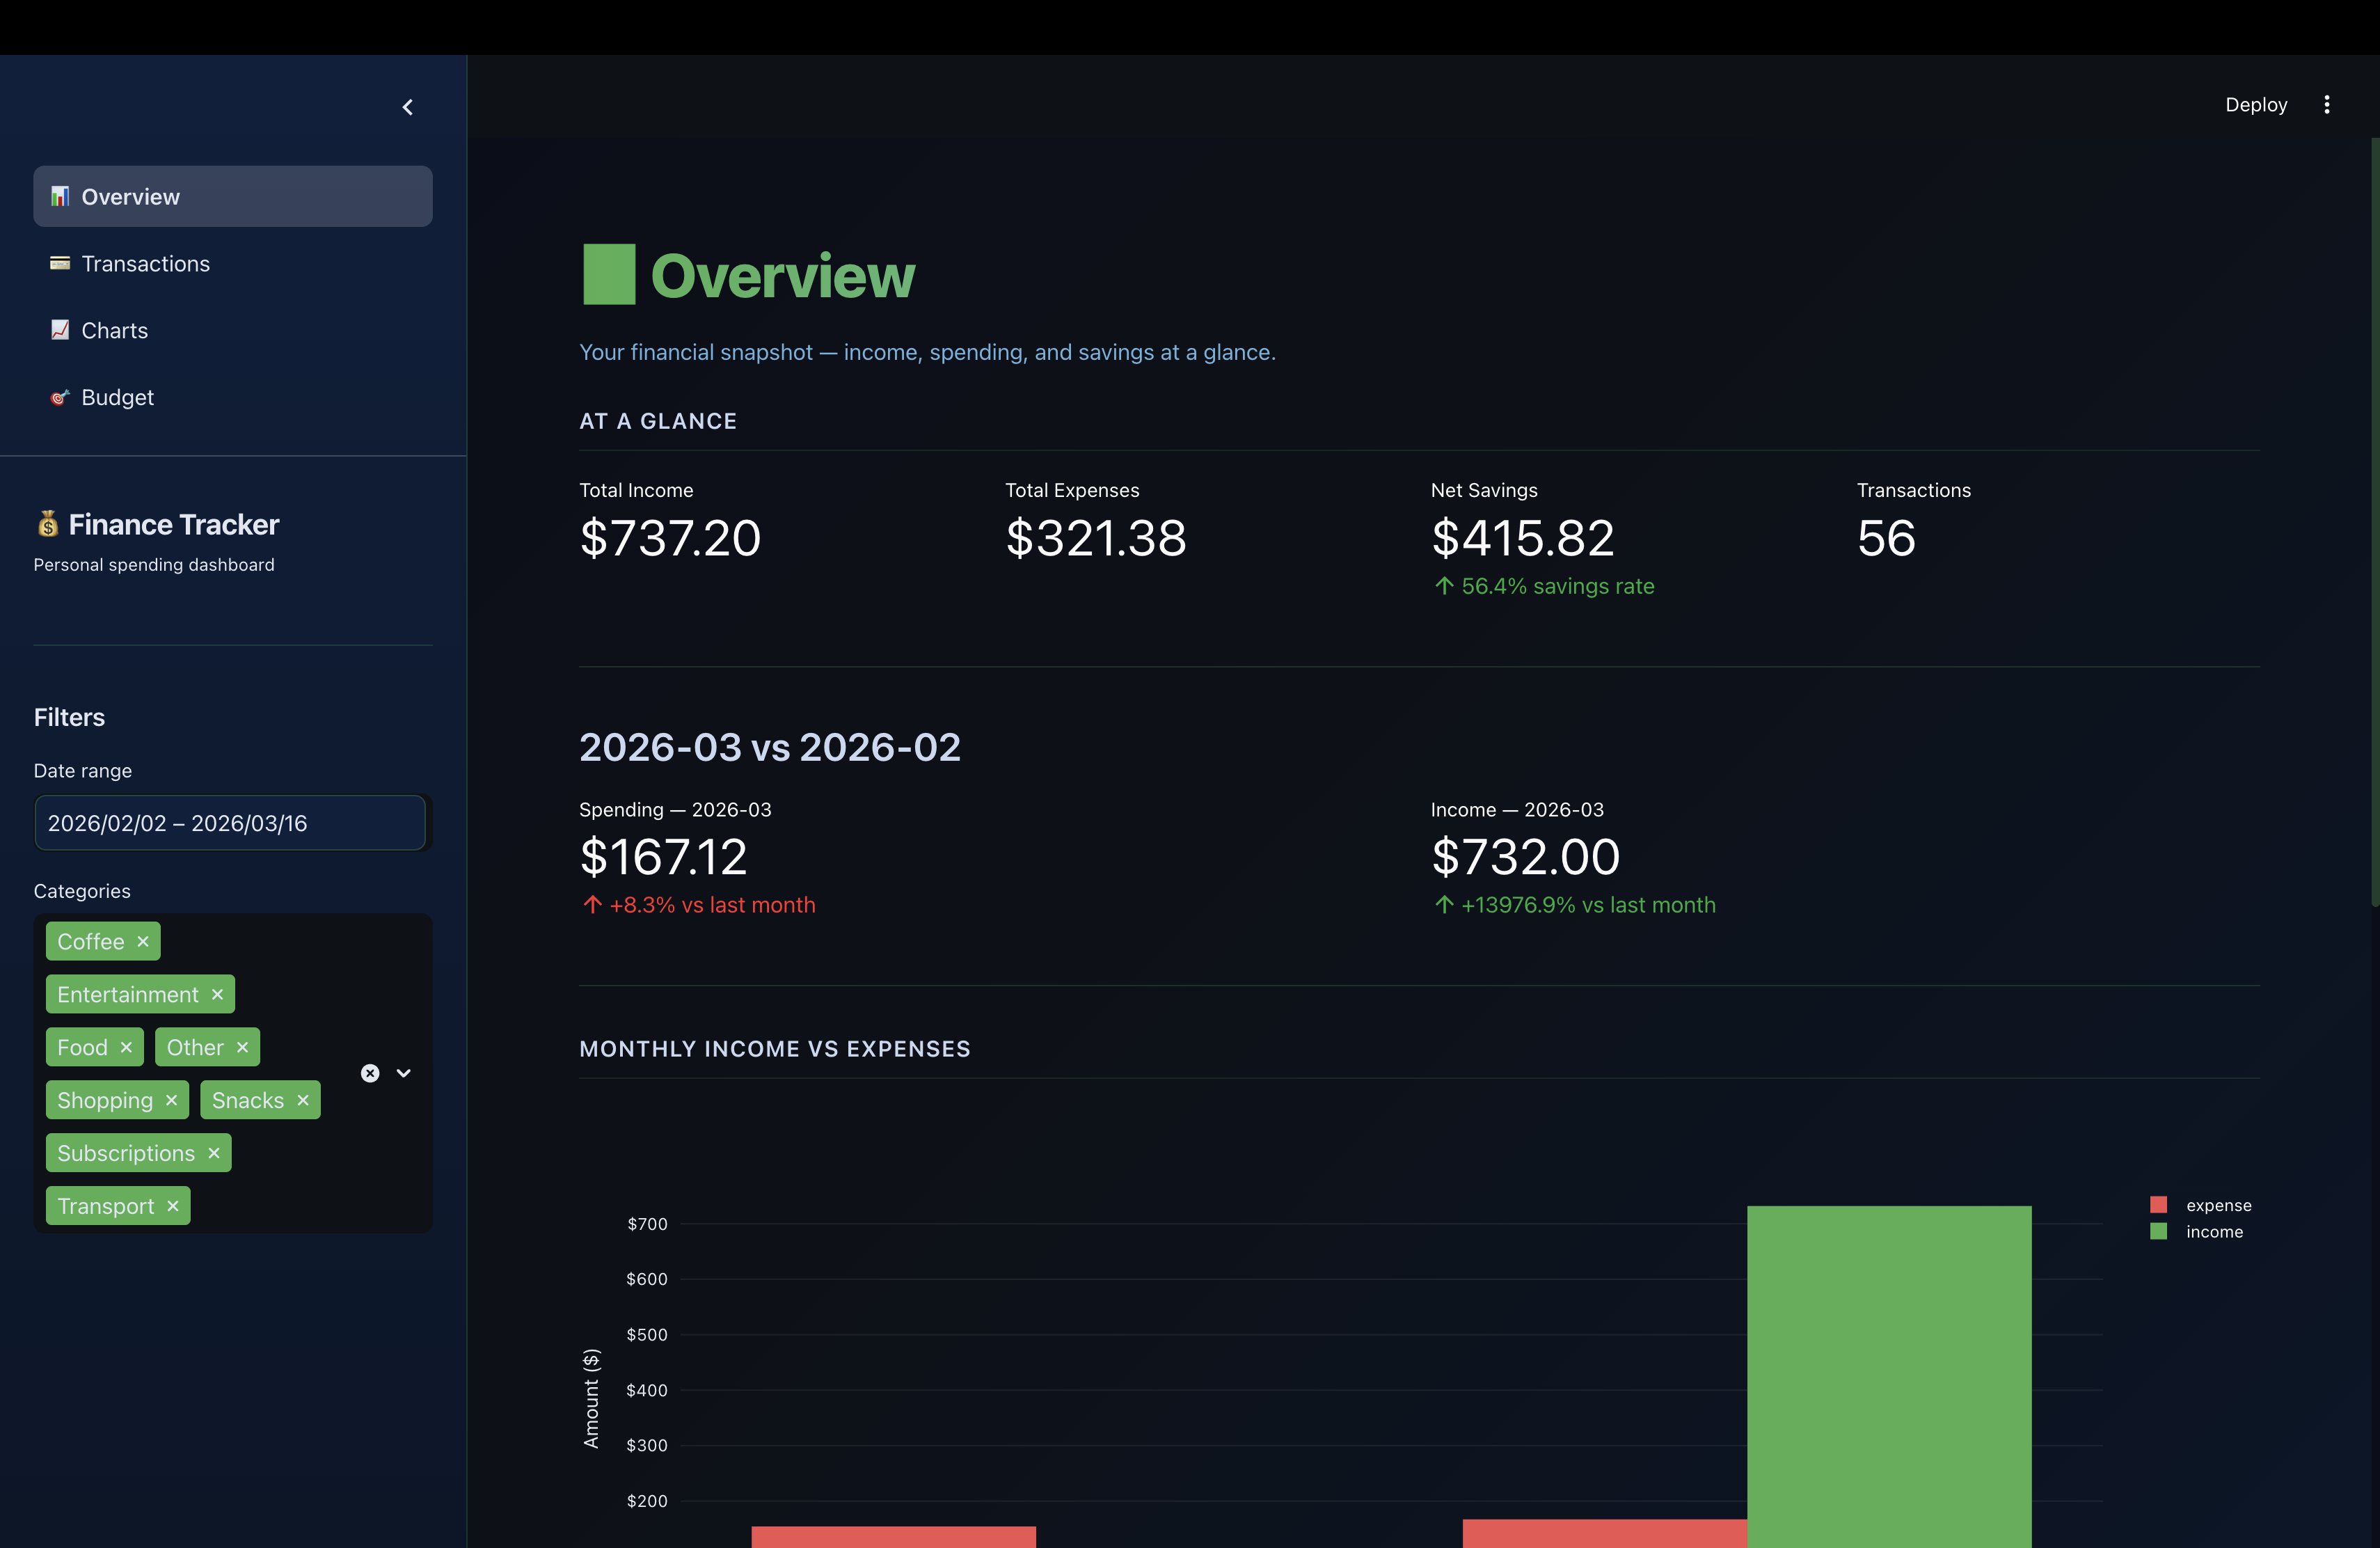
Overview Dashboard
KPI cards for total income, expenses, net savings, and savings rate, with month-over-month comparison at a glance.
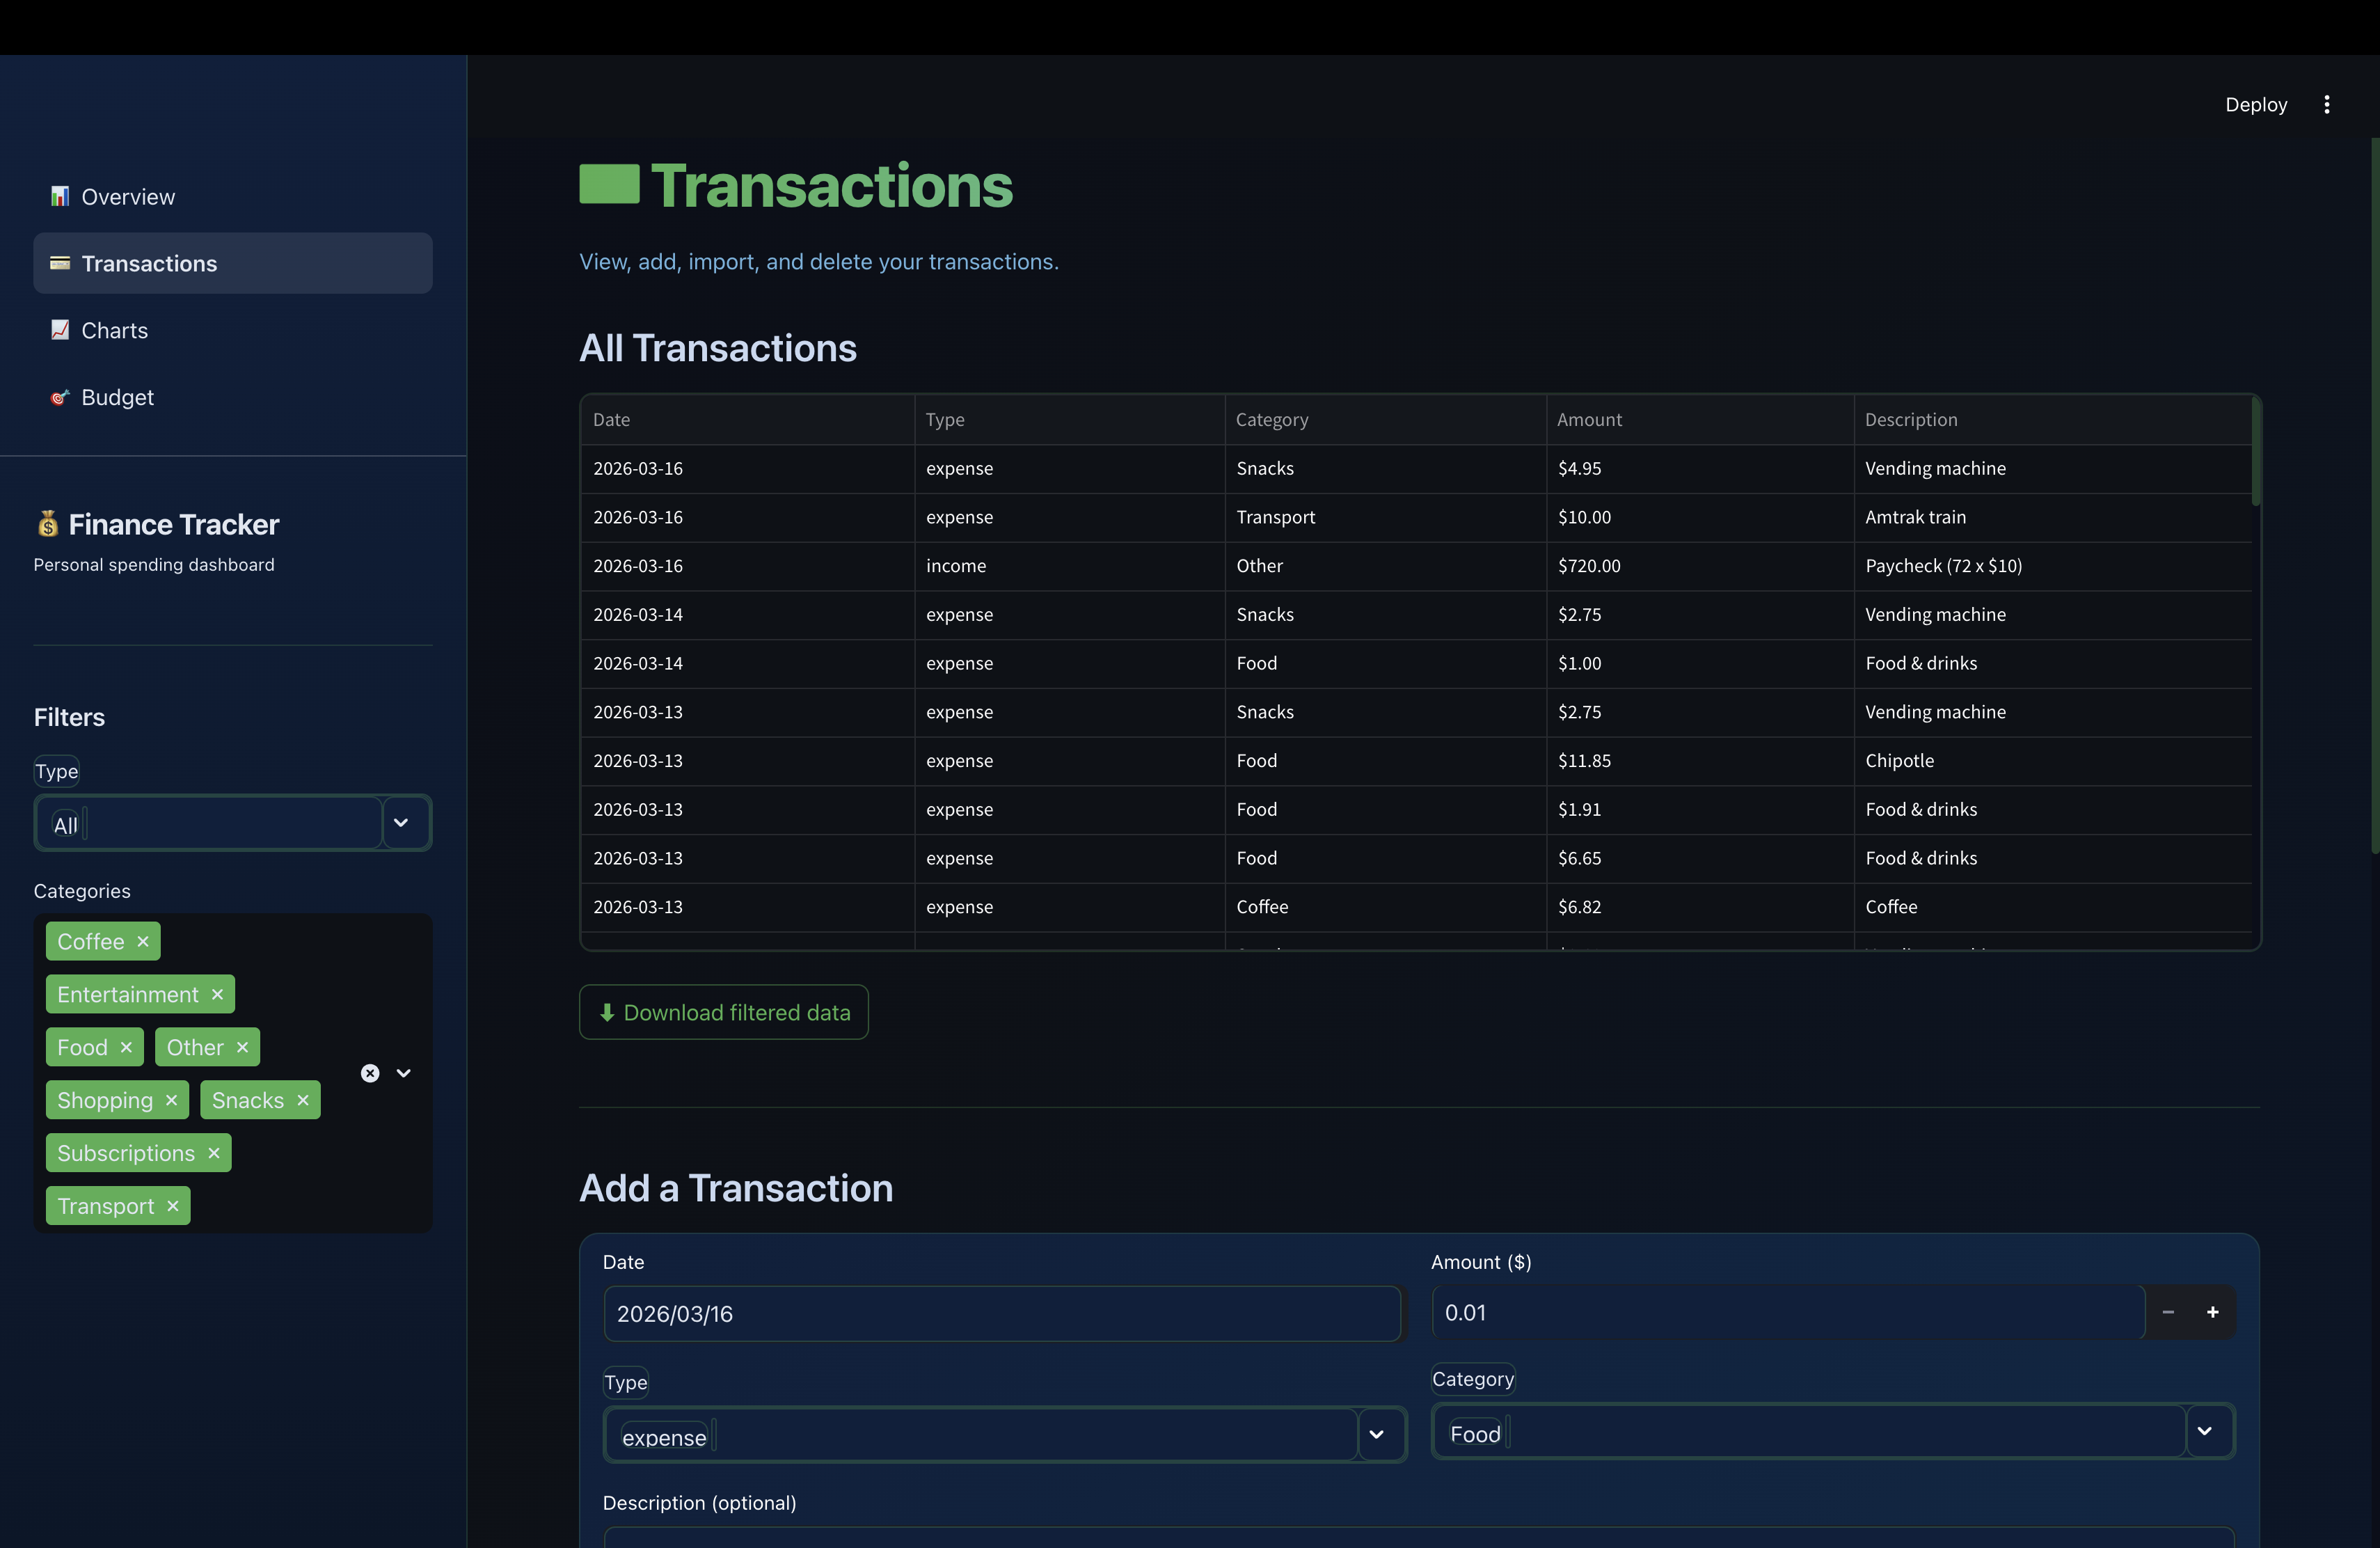
Transaction Management
Add, delete, and bulk-import transactions with automatic deduplication; importing the same CSV twice never creates duplicates.
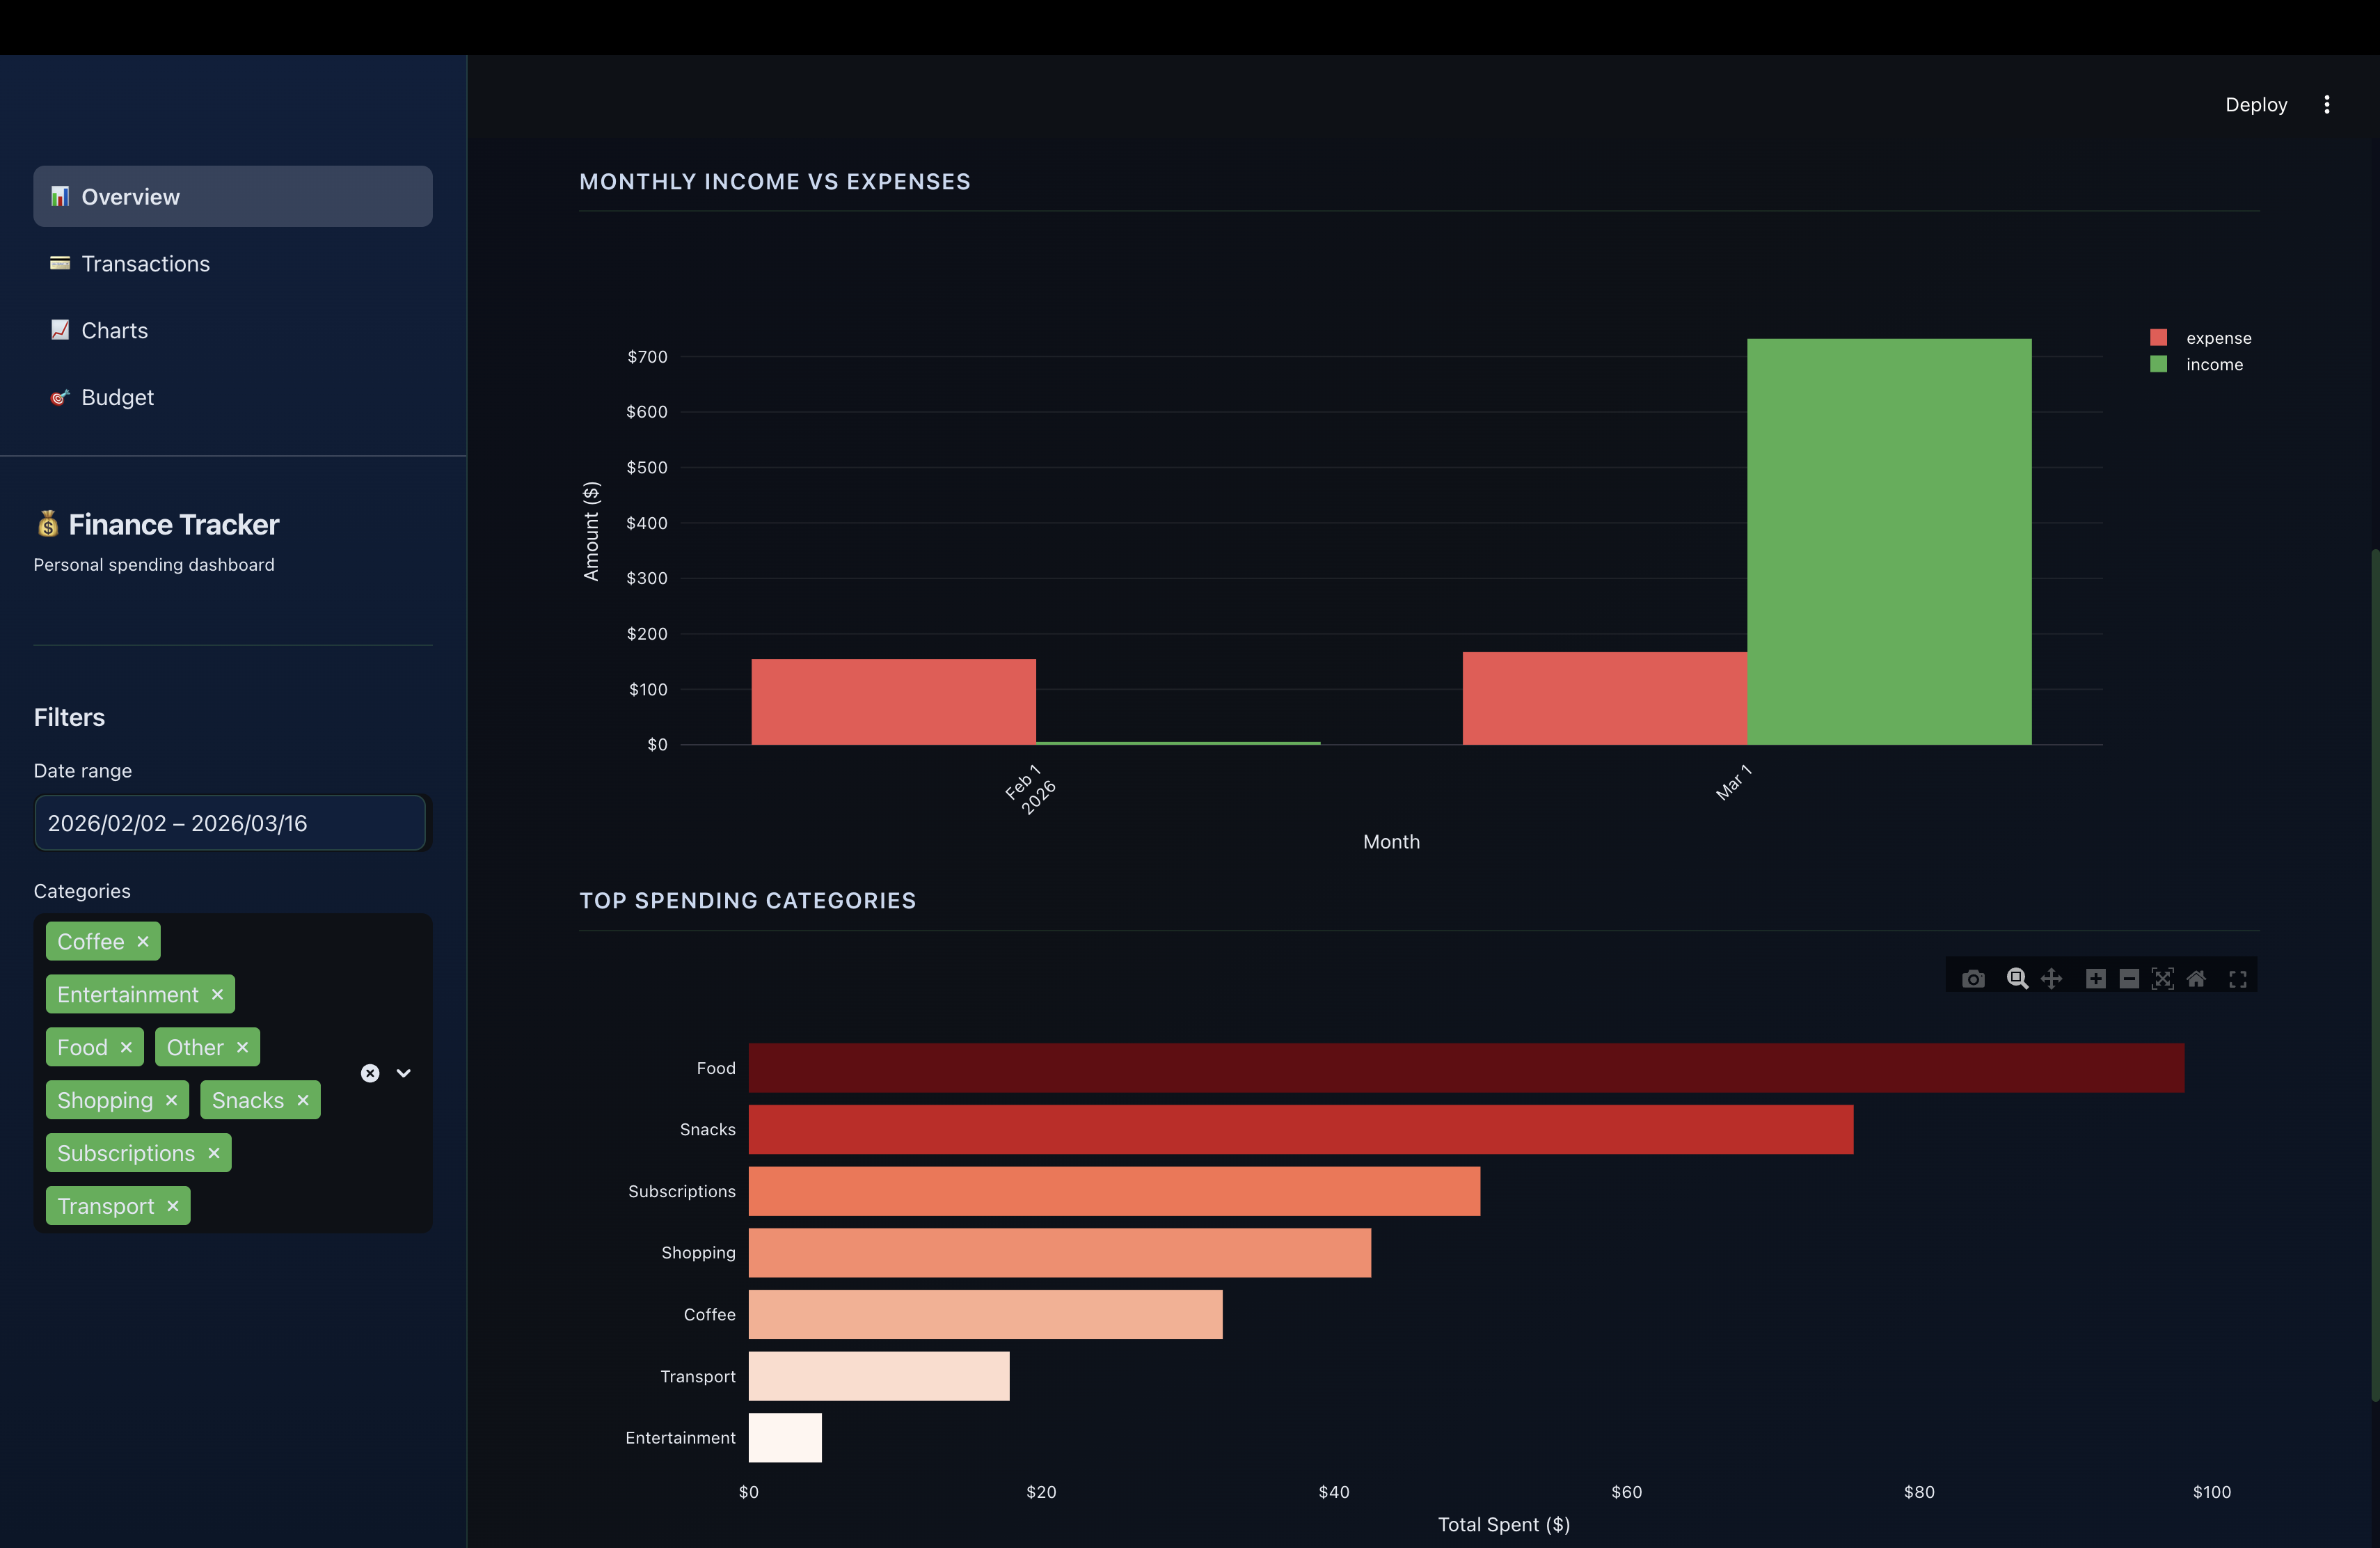
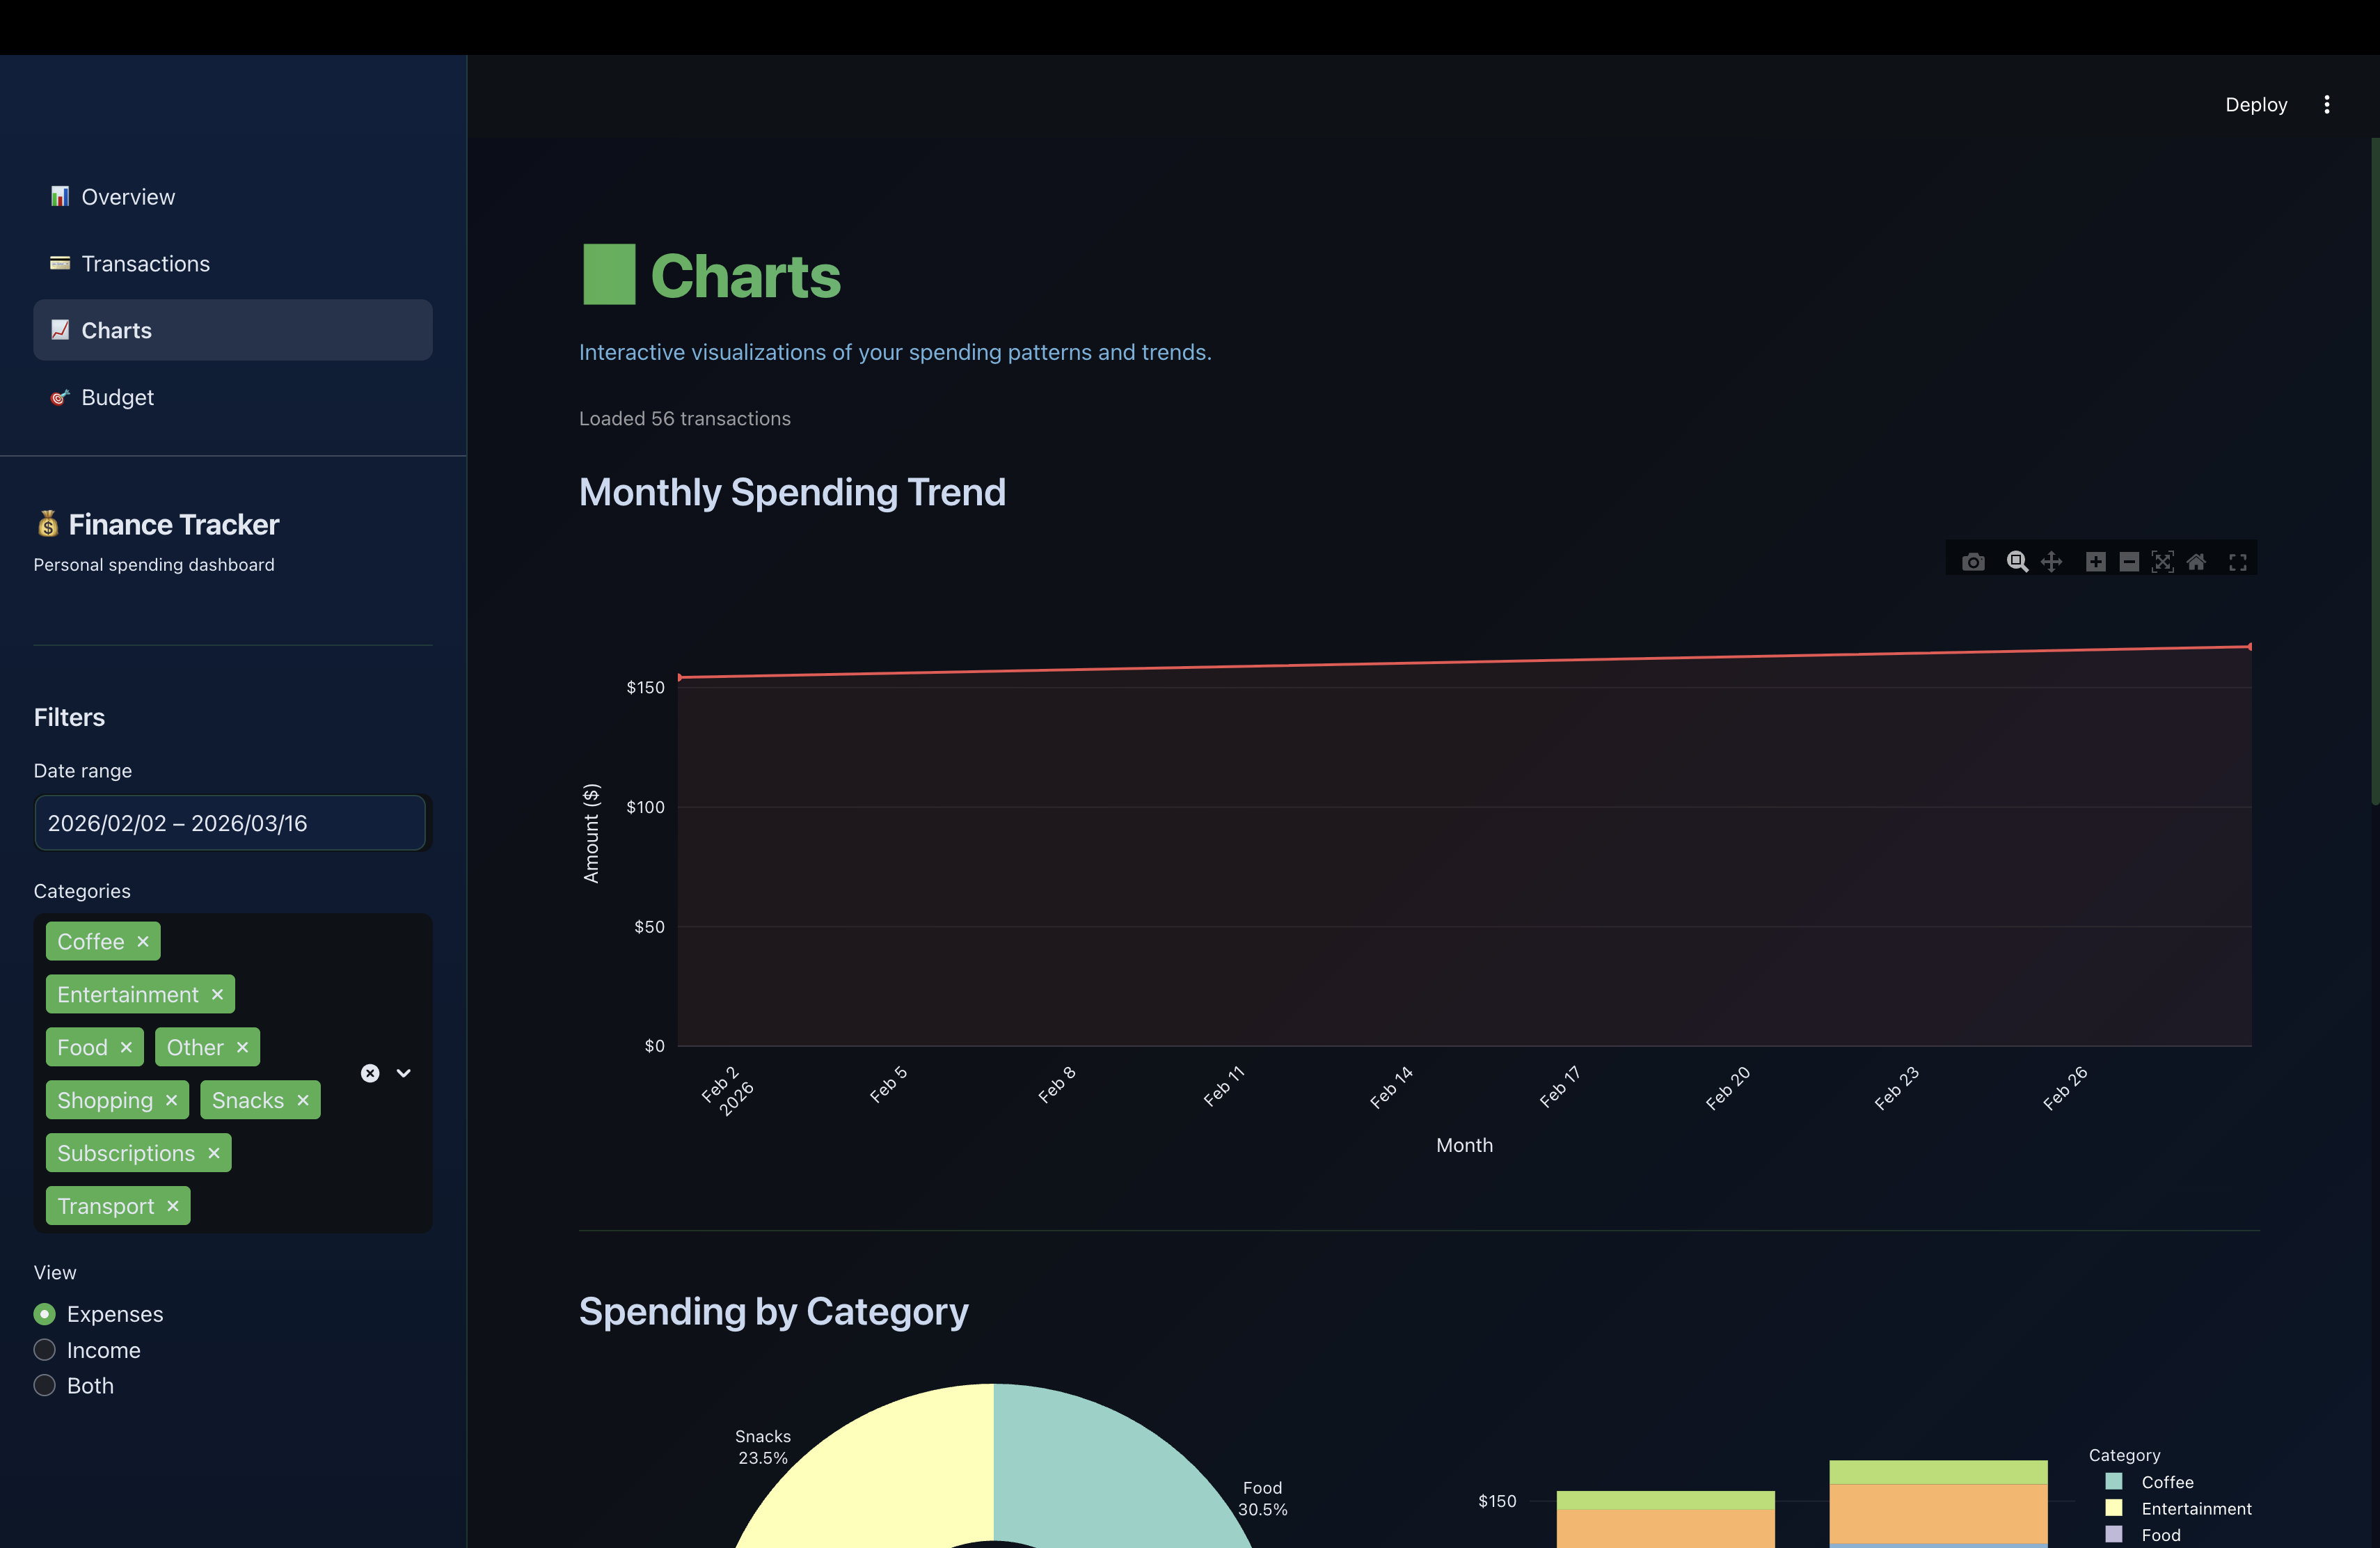
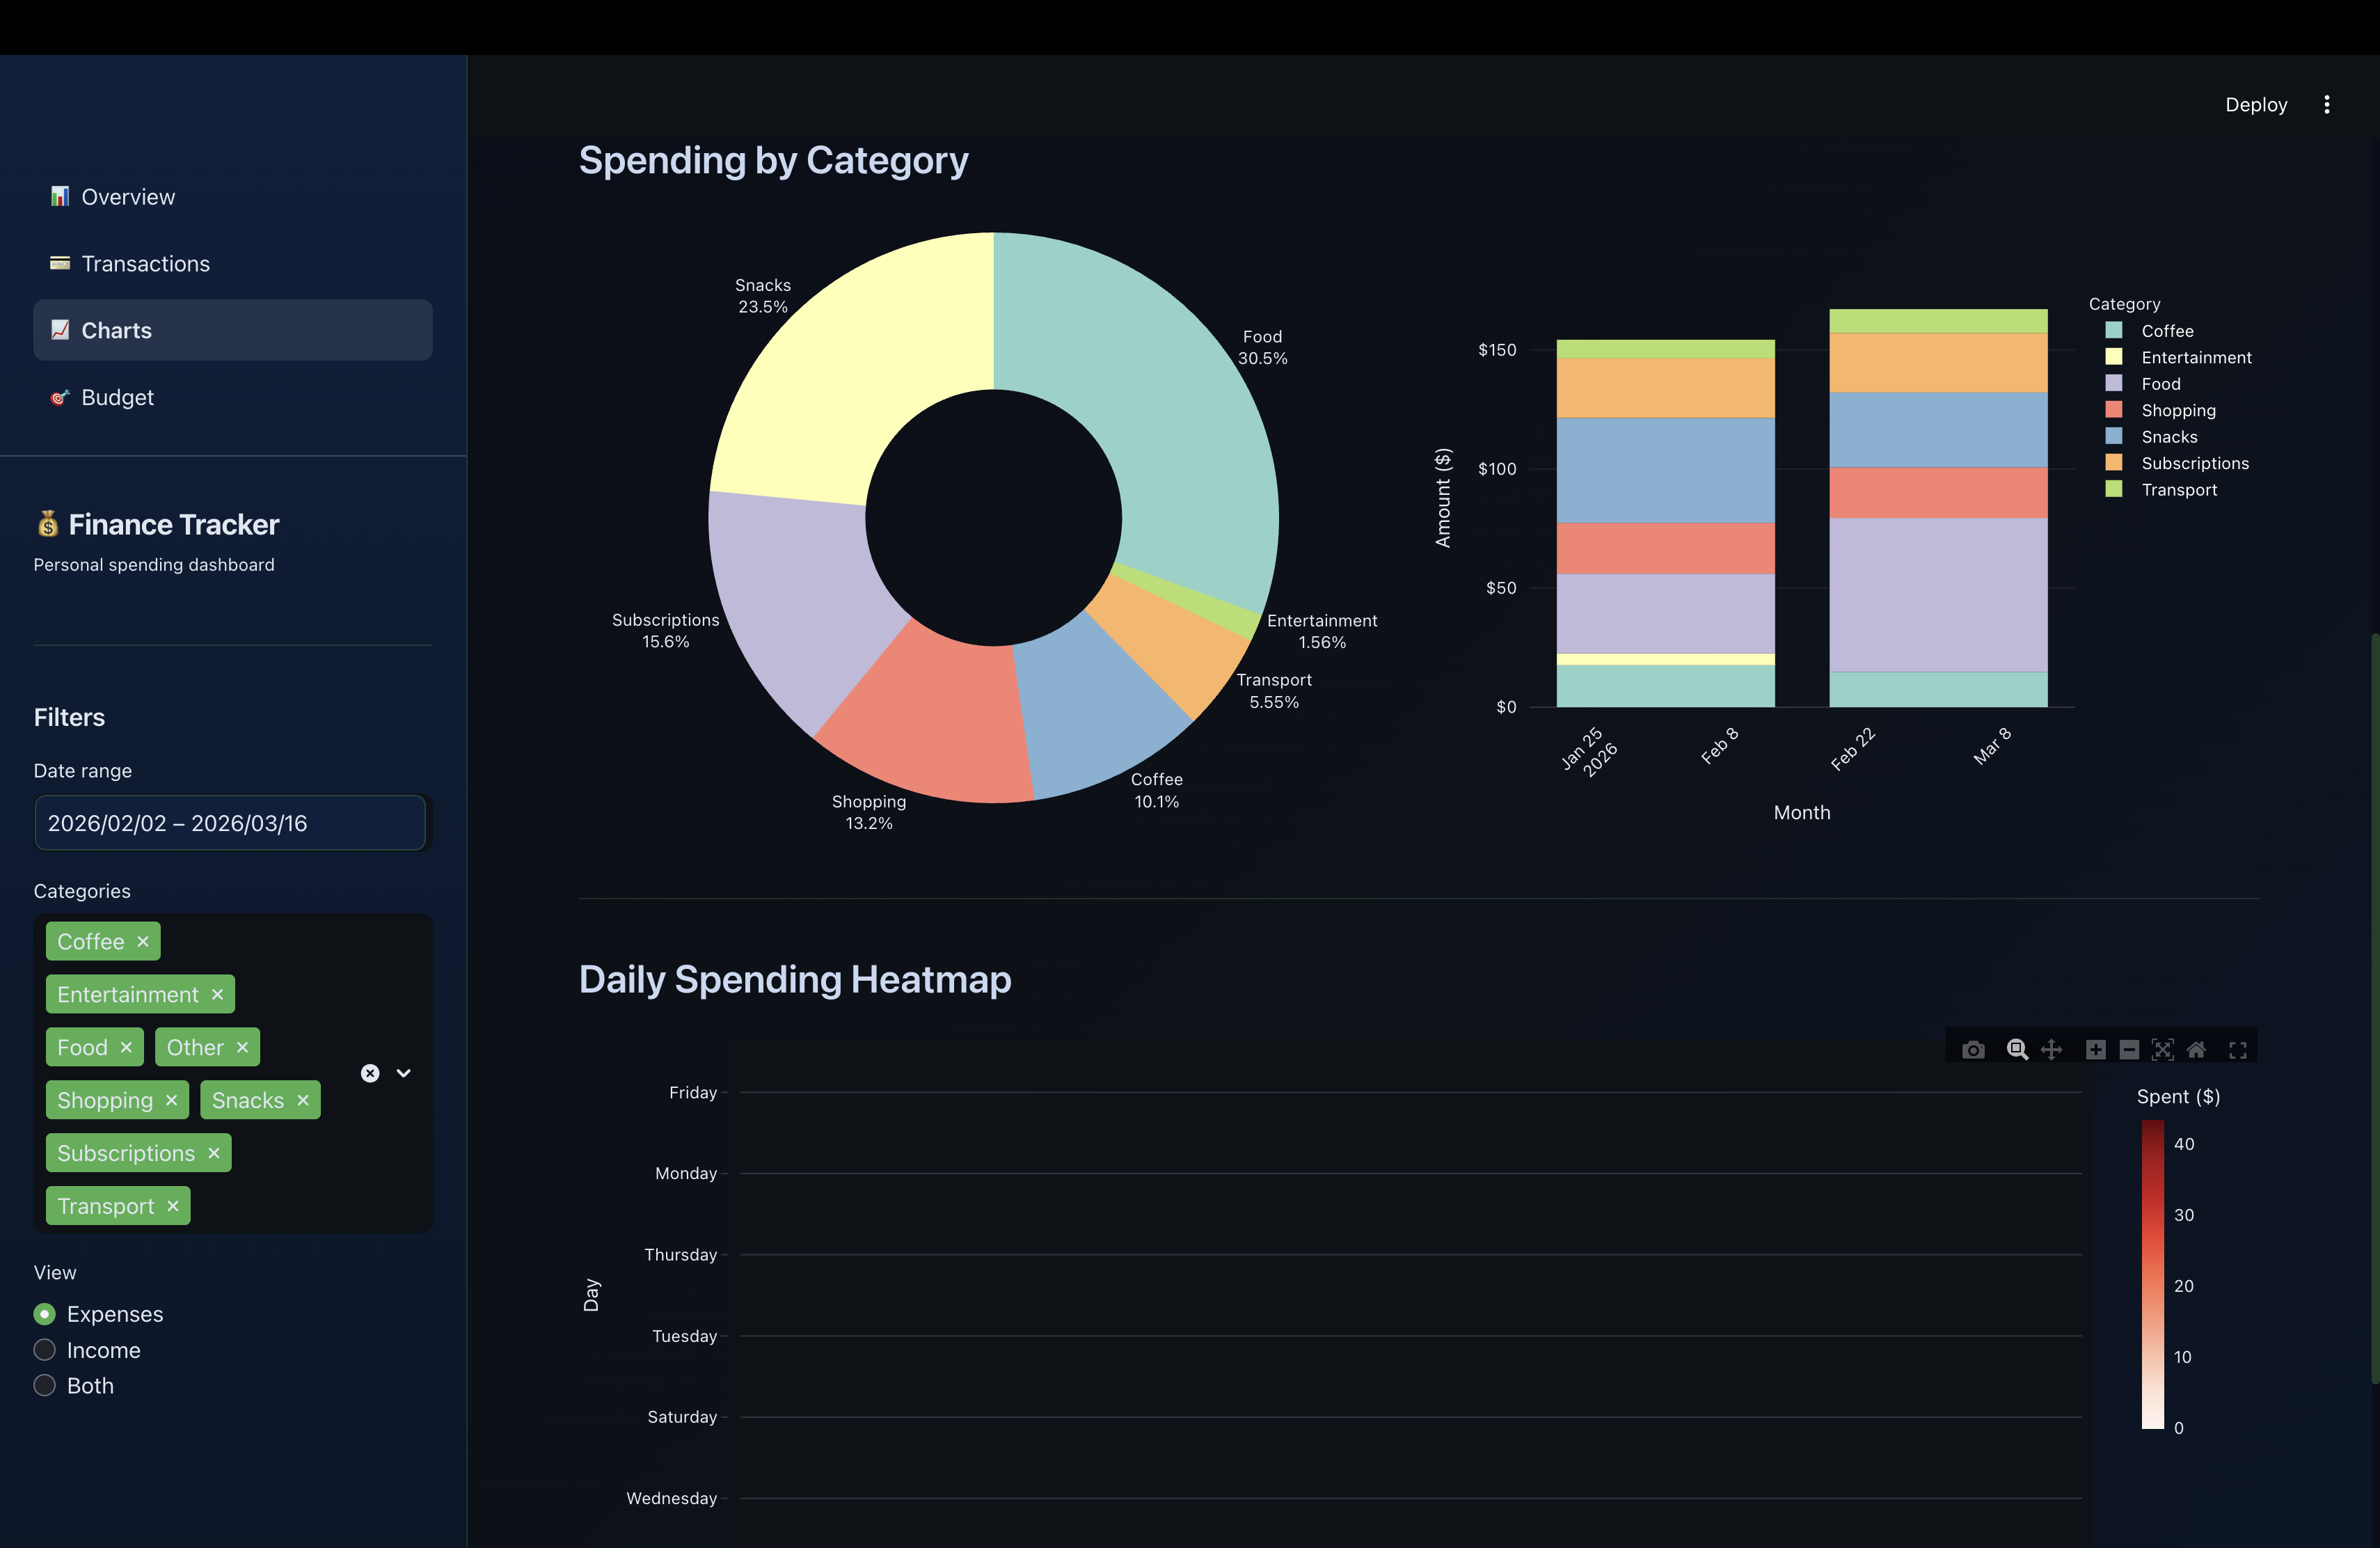
Interactive Charts
Spending trend line, category donut chart, stacked monthly bar chart, and a daily spending heatmap, all built with Plotly.
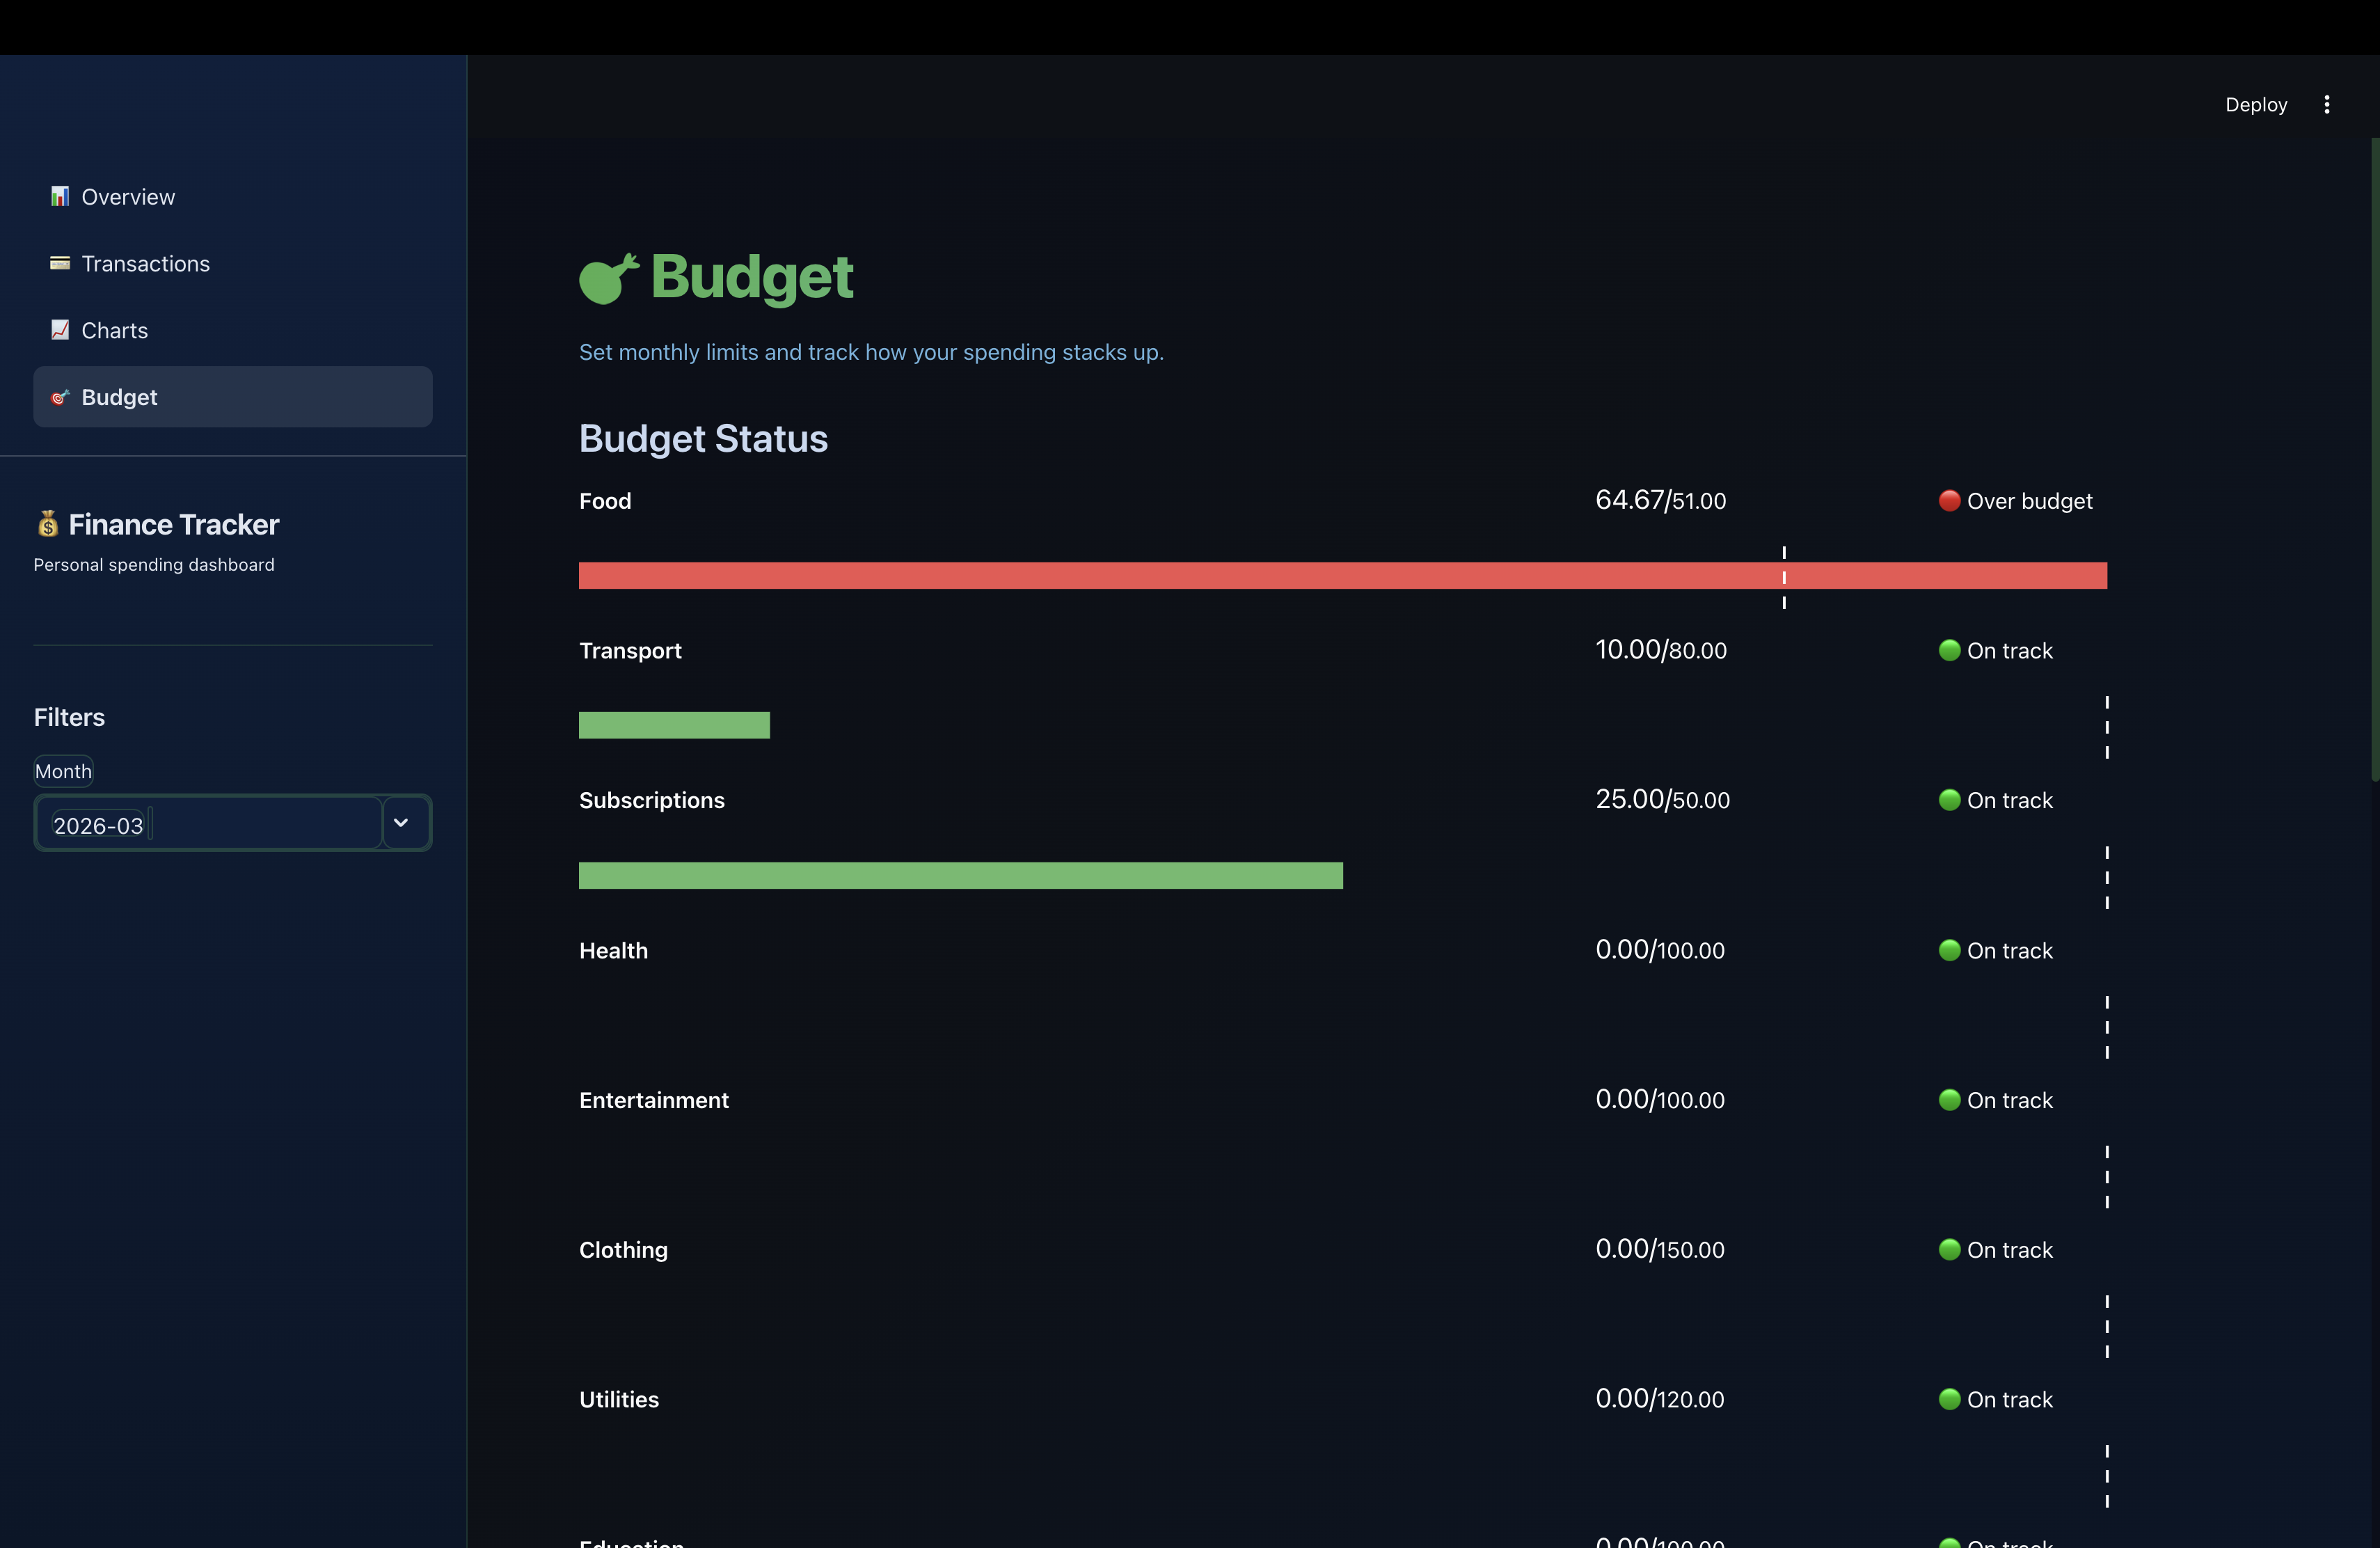
Budget Tracking
Set monthly limits per category with color-coded progress bars that shift from green to amber to red as you approach and exceed your budget.
Custom Categories
Add and manage your own spending categories: food, transport, subscriptions, and anything else that fits your habits.